Bicycles produced this year:
Sources and methods:
Two major sources for statistical data on bicycle production are Bicycle Retailer and Industry News and the Bicycle Market Research Institute. There are over a dozen additional sources (see references at the end of this page) that are analyzed by Worldometer's team to derive our final estimate.
Statistics on bike production are also found in papers that are presented at conferences such as VeloCity, ProBike and the Transportation Research Board (TRB).
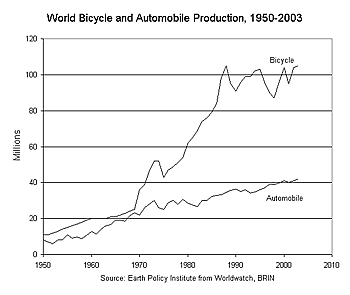
Bicycle vs. car production
As recently as 1965, world production of cars and bikes was essentially the same, with each at nearly 20 million, but as of 2003 bike production had climbed to over 100 million per year compared with 42 million cars. Bicycle production was 105 million units globally in 2004, a 1.5% increase over 2003 (WorldWatch Institute).

Which country is the biggest producer of bicycles?
China. Although bicycles are produced in dozens of countries, the top five producers - China, India, the European Union, Taiwan, and Japan - are responsible for 87% of global production. China alone had some 58 percent of the global market in 2004. The following year, 2005, was a record year for the production of bicycles in China with a 16% increase in the production of bicycles and E-Bikes to a total of 80,430,000 units produced, of which about 65% were exported. The People's Republic of China today produces over 60% of the world's bicycles. 86% of the bicycles sold in the US are imports from China.
However, cycle use in China is decreasing sharply, down to 20% of all trips, compared to 33% in 1995. In Beijing, only 20% of commuters rode bikes in 2002, compared to 60% in 1998.
How many bicycles are there in the world?
It is estimated that more than a billion bicycles are present in the world, with nearly half of them in China. Below is a table with the major countries:
| Country | Quantity | Year |
|---|---|---|
| China | 450,000,000 | 1992 |
| USA | 100,000,000 | 1995 |
| Japan | 72,540,000 | 1996 |
| Germany | 62,000,000 | 1996 |
| India | 30,800,000 | 1990 |
| Indonesia | 22,300,000 | 1982 |
| Italy | 23,000,000 | 1995 |
| UK | 20,000,000 | 1995 |
| France | 20,000,000 | 1995 |
| Brazil | 40,000,000 | 1996 |
| Netherlands | 16,500,000 | 2000 |
| Canada | 10,150,000 | 1992 |
| Spain | 6,950,000 | 1995 |
| Sweden | 6,000,000 | 1995 |
| South Korea | 6,500,000 | 1985 |
| Mexico | 6,000,000 | 1986 |
| Belgium | 5,200,000 | 1995 |
| Rumania | 5,000,000 | 1995 |
| Denmark | 4,500,000 | 1995 |
| Switzerland | 3,800,000 | 1996 |
| Hungary | 3,500,000 | 1995 |
| Australia | 3,300,000 | 1995 |
| Finland | 3,250,000 | 1995 |
| Norway | 3,000,000 | 1995 |
References and useful links:
- Bicycle Retailer and Industry News - the leading source of news and information about the bicycle industry in North and South America, Europe and Asia
- National Biker Dealers Association
- WorldWatch Institute - Bicycle Production up slightly
- Bike Biz Statistics
- Bicycle statistics from Ibike.org
- United Nations Statistics Division
- Bike Europe - the web site for the global bicycling business
- European Bicycle Manufacturers Association
- Eurostat
- Japan Bicycle Promotion Institute
- Taiwan Bicycle Exporters Association